

To inspect an element in Google Chrome on a computer, right-click the item on a webpage and select Inspect. Chrome opens Developer Tools with that item selected in the Elements panel, while Styles shows its CSS. These desktop steps cover Windows, macOS, Linux, and ChromeOS, with platform differences noted for each method.
To inspect Chrome on Android, connect your phone to a Windows, macOS, or Linux computer. For Chrome 115 or later on iOS or iPadOS 16.4 or later, use a connected Mac with Safari’s developer features enabled.
The short version
- Start with the item: Right-click it and select Inspect to open its node in Elements.
- Select with a shortcut: Press Ctrl + Shift + C on Windows, Linux, or ChromeOS, or Command + Option + C on macOS, then click the item.
- Use the browser menu: Open the three-dot menu and choose More Tools > Developer Tools.
- Inspect mobile pages remotely: Connect Android to a computer, or connect an iPhone or iPad to a Mac with Safari’s developer features enabled.
| Method or option | Where it works | Starting point |
|---|---|---|
| Right-click an item | Desktop Chrome | Select Inspect |
| Element selection shortcut | Desktop Chrome | Ctrl + Shift + C, or Command + Option + C on Mac |
| Chrome menu | Desktop Chrome | More Tools > Developer Tools |
| General DevTools shortcuts | Windows, Linux, and macOS | Ctrl + Shift + I, or Command + Option + I on Mac |
| Console shortcut | Windows, Linux, and macOS | Open Console, then select Elements |
| Mac application menu | Chrome on macOS | View > Developer > Inspect Elements |
| Element picker | Desktop Chrome | Click Inspect mode |
| Command Menu | Desktop Chrome | Select Show Elements |
| DOM tree | Desktop Chrome | Expand branches in Elements |
| Element search | Desktop Chrome | Search Elements by text, CSS selector, or XPath |
| Console command | Desktop Chrome DevTools | Run inspect(document.body) |
| Open pages listing | Desktop Chrome | Open chrome://inspect/#pages |
| Automatic DevTools opening | Windows, macOS, and Linux | Launch Chrome with --auto-open-devtools-for-tabs |
| Android connection setup | Android phones supporting USB debugging | Enable USB debugging |
| Android remote inspection | Android with a Windows, Mac, or Linux computer | Connect by USB and open chrome://inspect/#devices |
| Safari preparation | Current Safari on macOS | Check Show features for web developers |
| iPhone or iPad inspection | Chrome 115+ on iOS or iPadOS 16.4+, with a Mac | Enable Web Inspector |
| AI assistance setup | Eligible desktop Chrome users | Open Settings > AI innovations |
| AI element explanation | Eligible desktop users with AI assistance enabled | Select a node and click Debug with AI |
| Administrator access setting | Managed desktop Chrome | Find Developer tools availability |
| Administrator website restrictions | Managed desktop Chrome with URL policies available | Open Developer tools URL restrictions |
Inspect an item with a right click or shortcut
Open the webpage in Chrome, right-click the item you want to examine, then select Inspect. Chrome selects its DOM node in Elements, showing where it sits in the page’s structure. Look at Styles to see the selected element’s CSS.
To select an element with your keyboard and mouse, press Ctrl + Shift + C on Windows, Linux, or ChromeOS. On macOS, press Command + Option + C. Then click the page element you want to inspect.
To open DevTools first, press Ctrl + Shift + I on Windows or Linux, or Command + Option + I on macOS. You can also press F12 on Windows or Linux, or Fn + F12 on macOS. Select Elements after the tools open. Function-key behavior depends on your keyboard configuration, so use Chrome’s menu if that shortcut does not open the tools.
Open Developer Tools from Chrome’s menus
Click the three-dot menu beside Chrome’s address bar, then choose More Tools > Developer Tools. Select Elements in DevTools. Choose a node in the DOM tree or use the element picker to select something on the webpage.
On a Mac, choose View > Developer > Inspect Elements from the application menu. The same submenu also contains Developer Tools and JavaScript Console. If you choose either of those, select Elements after the tools open.
Find the element you need
With DevTools open, click the Inspect mode button in its action bar. Hover over the webpage to preview an element’s properties, then click it to select its DOM node. For an element styled with pointer-events: none, hold Shift while hovering to target it.
If an item is difficult to select on the rendered page, open Elements and expand the DOM tree. Select the node you want to examine. This lets you reach the element through the page’s structure.
To search instead, focus Elements and press Ctrl + F, or Command + F on macOS. Enter text, a CSS selector, or an XPath expression. Chrome selects matching nodes in the DOM tree.
Select an element with a Console command
You can also select a node by running inspect() in the DevTools Console. This is a DevTools utility, rather than a normal webpage JavaScript API. Open Console, enter the following command, then press Enter to select the page’s body in Elements:
inspect(document.body)To target another element, replace YOUR_SELECTOR with a matching CSS selector in the command below. Enter it in Console, then press Enter:
inspect(document.querySelector('YOUR_SELECTOR'))Open DevTools automatically for new tabs
You can launch Chrome with a flag that opens DevTools for new tabs. Quit Chrome completely first, because the flag must apply to the first running Chrome instance. Use the command for your operating system below, then select Elements in the opened tools.
On Windows, open Command Prompt. Launch Chrome with this command:
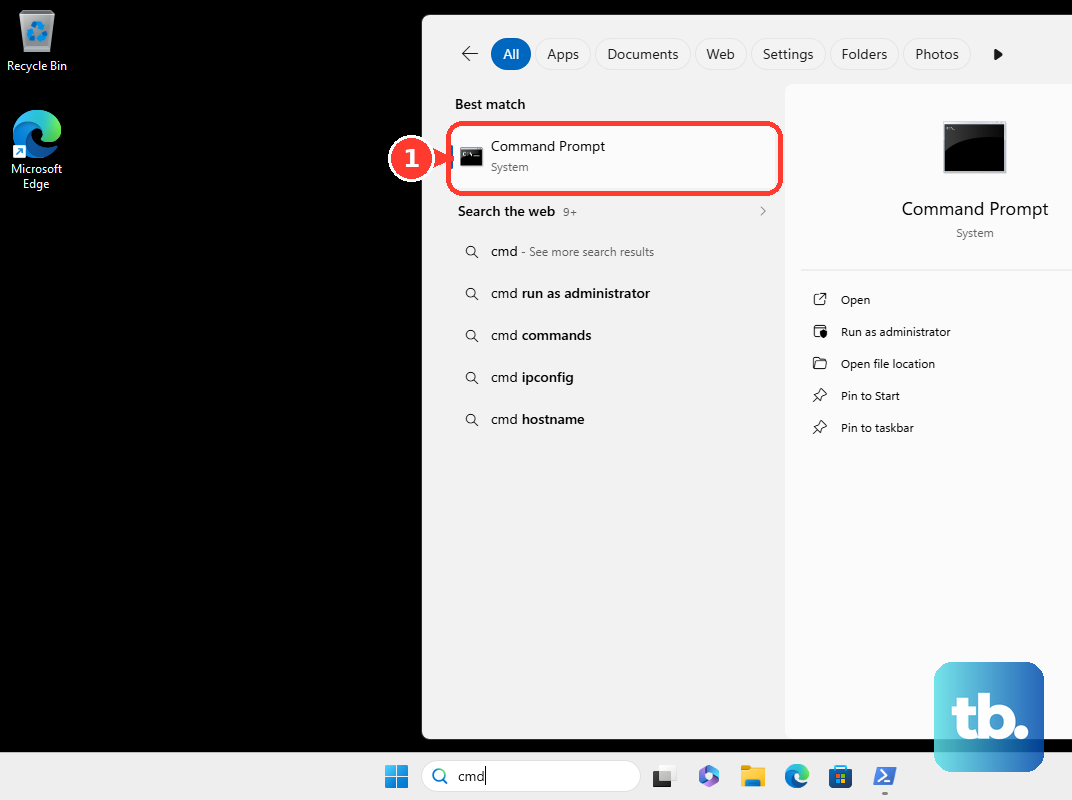
start chrome --auto-open-devtools-for-tabsOn macOS, open Terminal. Launch Chrome with this command:
open -a "Google Chrome" --args --auto-open-devtools-for-tabsOn Linux, launch Chrome with the command below. It enables automatic DevTools opening for new tabs:
google-chrome --auto-open-devtools-for-tabsSet up Android for inspection from a computer
To inspect Android Chrome, enable USB debugging on the phone. You then use Chrome’s inspection tools on a Windows, macOS, or Linux computer. Enabling USB debugging prepares the connection; it does not open an on-phone Elements panel.
On a Pixel, open Settings > About phone > Build number. On a Samsung Galaxy S8 or later, open Settings > About phone > Software information > Build number. Tap Build number seven times, then open Developer options and enable USB debugging.
The location of developer settings varies by manufacturer and Android release. Google’s generic Android 9 and later path is Settings > System > Advanced > Developer Options > USB debugging. Use your phone manufacturer’s location when its menus differ.
In Chrome on the computer, enter the following address:
chrome://inspect/#devicesCheck Discover USB devices, then connect the phone to the computer by USB. If you are connecting the phone for the first time, accept the debugging session prompt on the phone before opening the webpage in Chrome on Android. On the computer, click inspect beside that webpage’s URL. Use Elements or the element picker in the resulting DevTools window.
Set up iPhone or iPad inspection with a Mac
For Chrome 115 or later on iOS or iPadOS 16.4 or later, start by preparing Safari on your Mac. Choose Safari > Settings… > Advanced. Check Show features for web developers.
In Chrome on your iPhone or iPad, open Settings > Content Settings and enable Web Inspector. Relaunch Chrome, then connect the device to the Mac by cable. Open the webpage you want to inspect in Chrome on the mobile device.
Back in Safari on the Mac, open Develop, choose your device’s name, then select the webpage’s URL. This opens Web Inspector for the mobile Chrome page. You inspect the page in Safari on the Mac.
Ask AI assistance about an element
Google requires you to be 18 or older, in a supported location, using the latest version of Chrome, signed in to Chrome with your Google Account, and using English (US) as the DevTools language to use AI assistance. Organizational policy can also restrict availability. If you meet those requirements, open DevTools Settings > AI innovations, read Things to consider, then turn on AI assistance.
Select a node in Elements and click its Debug with AI button. Alternatively, right-click the node and choose a prompt from Debug with AI. Type a question about the element and press Enter.
You can also open AI assistance from the DevTools toolbar, select Show AI assistance through the Command Menu, or choose More options > More tools > AI assistance. If organizational policy restricts the feature, use the element picker, DOM tree, and Styles to inspect the element directly.
Fix blocked inspection on managed Chrome
On managed Chrome for Windows, macOS, Linux, or ChromeOS, your administrator can control access to DevTools. If inspection is blocked by policy, ask the administrator to review Developer tools availability. After access is enabled, you can inspect through Chrome’s normal menus and shortcuts.
If you administer the browser, open Google Admin console > Devices > Chrome > Settings, then select User & browser settings. For Chrome Enterprise Core, start at Chrome browser > Settings. Find Developer tools availability, select Always allow use of built-in developer tools, and click Save.
If inspection is restricted for particular websites and the URL policies are available, open Developer tools URL restrictions in the same administrator settings. Configure Allowed URLs for developer tools and List of URL patterns where developer tools are blocked, then click Save. Account for embedded-frame URLs as well as the main page’s URL.
Frequently Asked Questions
Can you move through elements using only the keyboard?
Yes. With the DOM tree in Elements focused, use Up and Down to move between nodes. Use Left and Right to collapse or expand branches.
How do you open the JavaScript Console with a shortcut?
Press Ctrl + Shift + J on Windows or Linux, or Command + Option + J on macOS. To inspect the page’s structure afterward, select Elements and choose a node.
How do you open Elements from the DevTools Command Menu?
With DevTools focused, press Ctrl + Shift + P on Windows, Linux, or ChromeOS, or Command + Shift + P on macOS. Type Elements, select Show Elements, and press Enter. Then select the desired DOM node.
How do you inspect a page from Chrome’s list of open pages?
Enter chrome://inspect/#pages in desktop Chrome’s address bar. Find the open webpage and click inspect. In the resulting DevTools window, select Elements and the desired node.