

To check your PC temperatures, launch HWiNFO, check Sensors-only, select Start, and read the temperature sensors for your hardware. For a quick GPU reading, open Task Manager and select Performance, then your GPU. The Windows menu steps below use Windows 11, and available readings depend on your hardware and drivers.
The short version
- Several components: HWiNFO displays temperature sensors exposed by supported hardware.
- Quick GPU check: Press Ctrl + Shift + Esc, select Performance, then select your GPU.
- While gaming: MSI Afterburner with RivaTuner Statistics Server can display supported temperature readings over a game.
- Storage: Windows 11 shows supported NVMe SSD temperatures, while CrystalDiskInfo covers additional supported drives.
| Method | What you can check | Main requirement |
|---|---|---|
| HWiNFO | Live and recorded component temperatures | Supported Windows PC and exposed sensors |
| Task Manager | GPU temperature | Windows 11 with a compatible GPU and driver |
| OMEN Gaming Hub | CPU and GPU temperatures | Supported HP OMEN or Victus PC |
| MSI Center | CPU and GPU temperatures | Supported MSI system |
| Alienware Command Center | CPU and GPU temperatures | Supported Alienware or Dell gaming system running version 6.x |
| NitroSense | CPU and GPU temperature graphs | Compatible Acer Nitro gaming notebook |
| MSI Afterburner with RTSS | Desktop GPU temperature and an overlay in games | Supported Windows system, game, and exposed sensors |
| Windows storage settings | NVMe SSD temperature | Windows 11 with a supported NVMe SSD |
| CrystalDiskInfo | SSD and hard drive temperatures | Supported Windows system, drive, and controller |
| ASUS firmware monitor | CPU and motherboard temperatures | Supported ROG X870E series motherboard |
| Linux lm-sensors | Available hardware temperatures | Supported kernel monitoring drivers |
Check several components with HWiNFO
Get HWiNFO from its official download page and choose Installer or Portable for your platform. Launch the application, check Sensors-only, and select Start. Look through the sensor window for the temperature entries belonging to the component you want to check.
Supported sensors can include your CPU, GPU, motherboard, memory, and drives. The selection depends on your hardware, so use the entries available for your system rather than expecting every component to appear.
Read your GPU temperature in Task Manager
Press Ctrl + Shift + Esc to open Task Manager, select Performance, then select the relevant GPU entry. Read the temperature in °C when your graphics driver exposes it. This is a GPU reading, not your CPU temperature.
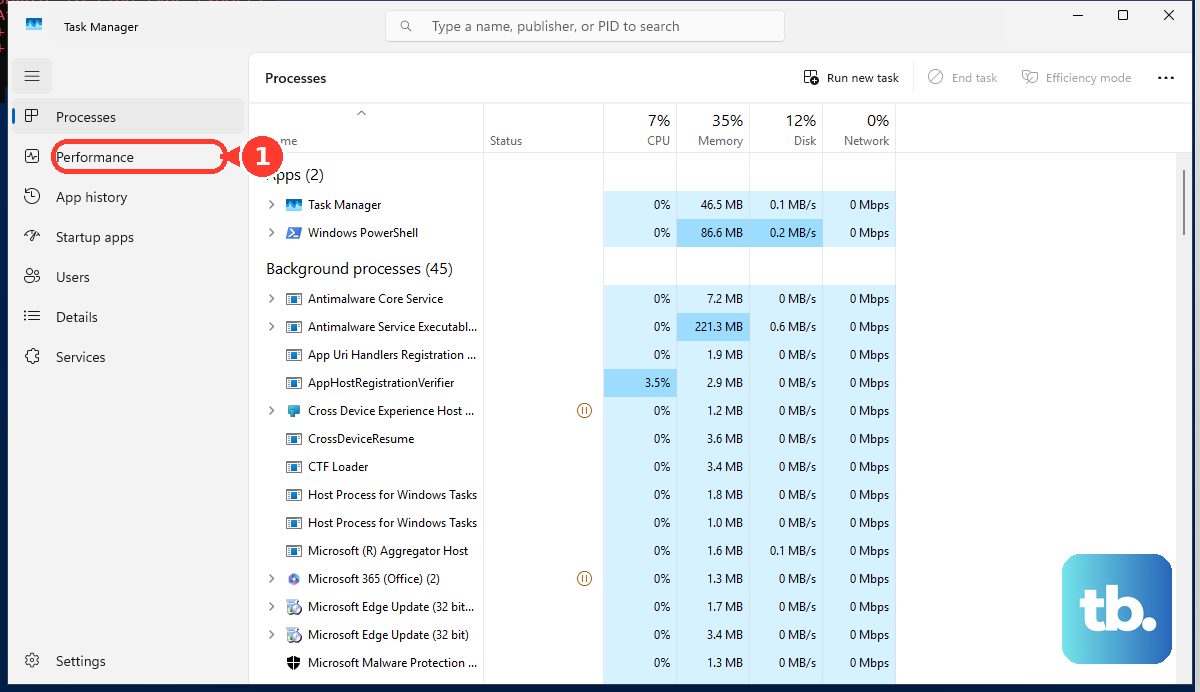
If the GPU entry has no temperature reading, try HWiNFO on supported hardware. To check your CPU, use HWiNFO or your computer's supported monitoring application below.
Use your gaming PC monitoring application
Your computer's monitoring application may provide the CPU and GPU readings you need. Choose the application supported by your particular model, since these features vary between systems.
On a supported HP OMEN or Victus PC, open OMEN Gaming Hub, select your computer, then select System Vitals. Read the CPU and GPU temperature values there. On an MSI notebook or another supported MSI system, open MSI Center > Hardware Monitoring to read its CPU and GPU temperatures.
On an Alienware or Dell gaming system supported by Alienware Command Center 6.x, open Alienware Command Center > Performance. Inspect the CPU and GPU Temp readings, or switch to the Thermal view.
On a compatible Acer Nitro gaming notebook, select NitroSense from Start. If your model has a dedicated key, you can also press NitroSense to open it. Read the CPU and GPU temperature graphs, including their recorded minimum and maximum values.
Display temperatures while gaming
Get the stable release of MSI Afterburner from its official download page and install the accompanying RivaTuner Statistics Server, also called RTSS. Afterburner works with supported GPUs beyond MSI-branded graphics cards. Launch it to read the GPU core temperature on its main interface.
On Windows 11, open Afterburner's Settings > Monitoring, select a temperature metric, and check Show in On-Screen Display. Repeat for the other available temperature metrics you want, then select Apply. Keep both Afterburner and RTSS running while you play.
The overlay requires a supported game and temperature sensors exposed by your hardware. For a desktop check, return to Afterburner's main interface or, on Windows 11, choose available monitoring values under Afterburner's Settings > Monitoring.
Check SSD and hard drive temperatures
On Windows 11, open Start > Settings > System > Storage > Advanced storage settings > Disks & volumes. Select Properties for the physical disk, then read Temperature under Drive health. A storage-health notification can also open the relevant details.
Microsoft limits this Windows monitoring feature to supported NVMe SSDs and excludes SATA SSDs and hard drives. For those drives, or another supported storage device, get CrystalDiskInfo through the Download link on its official product page. Support depends on your device and controller, including whether a USB or RAID connection passes the required information through.
Launch CrystalDiskInfo, use Disk to select the drive, and read Temperature in the main window. Select Function > Refresh for a new reading. To set the polling interval, use Function > Auto Refresh.
Read temperatures in supported ASUS firmware
On supported ASUS ROG X870E series boards, press Delete or F2 during startup. If the BIOS opens in EZ Mode, press F7 to switch to Advanced Mode. If it already opens in Advanced Mode, skip that key. Then open Monitor > Temperature Monitor. Read the available sensors, which can include CPU Temperature, CPU Package Temperature, and MotherBoard Temperature.
Sensor availability varies by board, and other manufacturers and models use different menus. Follow your motherboard's temperature-monitoring instructions, or use HWiNFO on a supported Windows PC.
Record temperatures during normal use
HWiNFO can save sensor readings while you use your usual applications or play a game. In its sensor window, use the logging button and choose a destination for the CSV file. Continue with your normal workload, then stop logging afterward.
Fix missing readings or a game overlay
If your computer's monitoring utility lacks the reading you need, try HWiNFO for sensors it supports. If HWiNFO lacks an entry, try the component-specific method, such as CrystalDiskInfo for a supported drive or Afterburner for a supported GPU. Each application's readings still depend on hardware support.
If Afterburner's overlay is missing, check that your chosen metric has Show in On-Screen Display enabled and that both Afterburner and RTSS are running. When the game does not support the overlay, use HWiNFO's logging option to record available temperatures during play.
Check temperatures on a Linux PC
On Linux, obtain the lm-sensors package through your distribution. With the package installed and the applicable sensor drivers loaded, open a terminal and run this command:
sensorsRead the hardware readings returned by the command. Sensor names and coverage depend on your hardware and supported kernel monitoring drivers, so different PCs can return different results.
Frequently Asked Questions
Can you use a simpler tool just for CPU temperatures?
Core Temp displays individual processor-core temperatures in its main window. On a supported Windows system with a compatible Intel, AMD, or VIA x86 processor, launch it and leave it running to observe changes during your usual workload.
Can you put a temperature reading in the Windows notification area?
HWMonitor PRO for Windows can place a readable temperature sensor in the notification area. Right-click the sensor and select Add to tray, or select it and choose View > Add Selection to Tray.
Can Ryzen Master monitor temperature without changing tuning settings?
On supported Ryzen desktop systems, Ryzen Master 3.x lets you inspect processor temperature through its read-only Dashboard. AMD supplies separate download branches for Ryzen 5000 series and later, Ryzen 3000 through 4000 series, and Ryzen 2000 series and earlier, so choose the branch matching your processor.
Do you need NZXT hardware or an account to use NZXT CAM?
You do not need NZXT hardware or an account for ordinary PC monitoring with CAM on Windows 10 or Windows 11. You can view temperature readouts and graphs for supported sensors, with Mini mode providing a compact desktop display. NZXT-specific cooling and display controls require compatible hardware.